Impact of Changes in Medical Aid Status on Unmet Need and Catastrophic Health Expenditure: Data from the Korea Health Panel
Article information
Abstract
Purpose
To investigate whether changes in Medical Aid (MA) status are associated with unmet need and catastrophic health expenditure (CHE).
Methods
Data from the 2010 to 2014 Korea Health Panel (KHP) were used. The impact of changes in annual MA status (‘MA to MA,’ ‘MA to MA Exit,’ ‘MA Exit to MA,’ and ‘MA Exit to MA Exit’) on unmet need (all-cause and financial) and CHE (10% and 40% of household capacity to pay) were examined using the generalized estimating equation (GEE) model. Analysis was conducted separately for MA type I and II individuals.
Results
In 1,164 Medical Aid type I individuals, compared to the ‘MA to MA’ group, the ‘MA to MA Exit’ group had increased likelihoods of all-cause and financial unmet need. This group also showed higher likelihoods of CHE at the 10% standard. The ‘MA Exit to MA Exit’ group showed increased likelihoods at the 10% and 40% CHE standards. In 852 type II recipients, the ‘MA to MA Exit’ group had higher likelihoods of CHE at the 10% standard.
Conclusions
Type 1 MA exit beneficiaries had higher likelihoods of all-cause and financial unmet need, along CHE at the 10% standard. Type I ‘MA Exit to MA Exit’ beneficiaries also showed higher likelihoods of CHE at the 10% and 40% standards. In type II recipients, MA exit beneficiaries had higher likelihoods of CHE at the 10% standard. The results infer the importance of monitoring MA exit beneficiaries as they may be vulnerable to unmet need and CHE.
Ⅰ. Introduction
South Korea operates a Medical Aid (MA) program guaranteeing the provision of appropriate health care services to selected low-income individuals to [1]. In contrast to the National Health Insurance (NHI) system that covers around 97% of the population funded through income level insurance premium contributions, the MA program is a public medical assistance program funded entirely by the government under the National Basic Livelihood Security Act [2]. In Korea, MA beneficiaries are classified into types I and II based on work capacity. Specifically, the type I category encompasses individuals or households without labor capability and other specific cases whereas the type II category embraces households with work-capable individuals [3]. Unsurprisingly, recipient copayment levels differ between type I and II individuals, with type II beneficiaries being subject to higher amounts of copayment for outpatient and inpatient services. In brief, type I individuals are not subject to paying for inpatient services while type II individuals are responsible for 10% of the total costs. Regarding outpatient services, type I individuals are required to pay between 1,000 and 2,000 Korean Won (KRW) depending on the level of medical institution, and are provided a monthly health maintenance fee of 6,000 KRW to support copayments, with a maximum ceiling being applied to limit out-of-pocket expenditure. In contrast, type II individuals pay 1,000 KRW for outpatient services at primary clinics and 10% of the total costs for services at secondary or tertiary hospitals.
Public assistance is important to ensure that socially vulnerable individuals maintain adequate living standards. Concurrently, social security systems need to prevent individuals from falling into poverty traps, which requires the implementation of self-sufficiency rather than income transfer programs under necessary conditions [4]. Similarly, the MA system aims to guarantee appropriate access to health care services and assist needy individuals to attain economic independence [5]. In fact, a self-sufficiency program largely targeting MA individuals, particularly those with work capacity, is currently operated by the government to decrease welfare dependency [6-7]. The government aims to decrease welfare expenditure, promote better use of health care services, and alleviate welfare dependency of work-capable beneficiaries by pursuing appropriate MA exits.
Under such circumstances, health care utilization of MA beneficiaries has been of concern as beneficiaries are reported to be utilizing higher amounts of health care services than NHI covered individuals, even after adjustment for health-related characteristics [8]. It is known that certain characteristics are shared by the MA group, including old age, low education level, higher likelihood of disability, and poor health partially impacted by low health literacy and management skills [9]. However, the fact that beneficiaries have been reported to utilize around three times higher medical costs than their NHI counterparts, along with the increasing trends in total expenditure, has led to concerns for moral hazard [10]. This is because recipients can use medical services by paying only a part of the total medical costs, which can result in unnecessary medical overuse [11].
Simultaneously, the likelihood of increased unmet needs and mild catastrophic health expenditure (CHE) also needs to be considered because the NHI program is operated under a low cost–low benefit policy, which may lead to high out-of-pocket costs [12-13]. Health care spending is regarded as being catastrophic when the amount exceeds a certain percentage of a household’s capacity to pay [14]. As the MA benefit package is fundamentally identical to that of the NHI, lower income individuals, including type II recipients subject to higher co-payments, may face higher levels of barriers in accessing medical care [12]. However, few studies have investigated the effect of MA beneficiary exits on unmet need and CHE using longitudinal, nationally representative data. Therefore, the aim of this study was to investigate whether transitions in MA status among beneficiaries were associated with higher likelihood of unmet need and CHE.
Ⅱ. Materials and Methods
1. Study population and design
This study used data from the Korea Health Panel (KHP) from 2011 to 2014. The KHP is provided by the Korea Institute for Health and Social Affairs (KIHASA) and the Korea National Health Insurance Service (KNHIS). The 2008 to 2014 KHP data selected nationally representative sample households using a twostage cluster method [15]. All members of the selected households were interviewed by researcher using a Computer Assisted Personal Interviewing (CAPI) technique to record information on health care utilization, health expenditure, socioeconomic characteristics, demographic characteristics, and other health-related behavior [15].
Information on unmet need and CHE was available from 2011 to 2014 in the KHP data. As this study aimed to investigate the effect of MA status change on health care utilization, unmet need, and CHE, data from 2010 to 2014 were utilized. Of the 17,035 individuals recorded in 2010, 443 had MA type I status and 415 type II status. Among type I individuals, 421 were followed up until 2011, of which 331 were aged 20 years or above. Similarly, among type II individuals, 402 were followed up until 2011, of which 222 were aged 20 years or above.
2. Outcome variable
The outcome variables of this study were unmet need and CHE. Unmet need was further categorized into unmet need due to all causes and unmet need due to financial reasons. Unmet need was measured based on self-reports to the question “Did you experience unmet need?” If individuals responded “yes” to the question, they were further asked about reasons behind their experience of unmet need. Available options included finance-, access-, health-, and time-related responses. Individuals who reported an experience of unmet need were classified into the “yes” unmet need category, and those who responded with having unmet need due to financial reasons were categorized into the “yes” unmet need due to financial reasons category. CHE was measured using the Xu method proposed by the World Health Organization (WHO), and calculated based on the percentage of health spending over a household’s capacity to pay [14]. Two different standards were used as thresholds for CHE—10% and 40% of a household’s capacity to pay. The 40% standard was applied as proposed by the WHO [16]. The 10% criteria was additionally considered to denote mild CHE based on previous Korean studies that identified health care spending exceeding 10% of the effective household’s income as an overburden [17].
3. Interesting variable
The interesting variable of this study was annual MA transition status. MA beneficiaries at the 2010 baseline were identified. Beneficiaries were then followed up in the subsequent year to check whether they remained as beneficiaries or lost their beneficiary status (“MA to MA” or “MA to MA Exit”). In other words, as the baseline consisted of only MA beneficiaries, participants were only classified into the “MA to MA” or “MA to MA Exit” groups at the first year of follow-up. Afterward, individuals who were followed up could be categorized into four groups depending on the transition status (“MA to MA,” “MA to MA Exit,” “MA Exit to MA,” and “MA Exit to MA Exit” groups [Figure 1]).
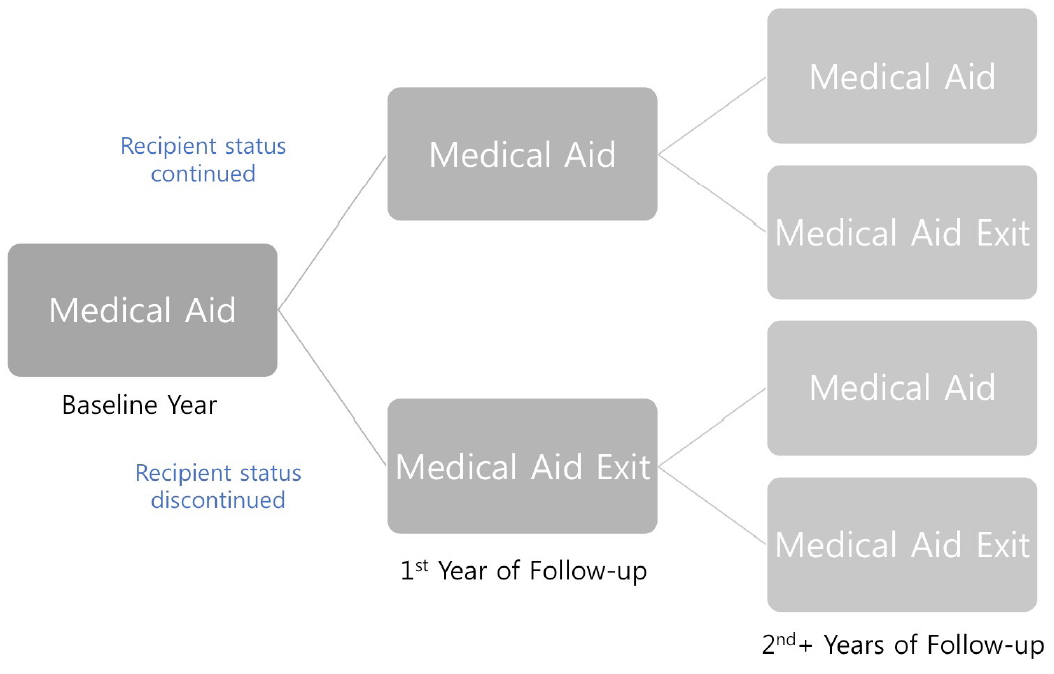
Categorization of the interesting variable.
4. Covariates
The covariates of this study were sex (male or female), age (20-29, 30-39, 40-49, 50-59, 60-64, 65- 74, 75-84, or 85+), region (Seoul, metropolitan, or rural), disability status (no or yes), number of chronic diseases (none, one to three, or four or above), rare disease status (no or yes), Charlson Comorbidity Index (CCI) (zero, one, two, three, four, or above), admission status (no or yes), year (2008 to 2015), education level (high school or below, or university or above), and household size (one to four or above).
5. Statistical analysis
The general characteristics of the study population were examined using chi-square test to examine differences between groups. In studying the effect of MA status change on occurrences of unmet need or CHE, logistic regression models were fitted using the generalized estimating equation model with log link function with calculations expressed as odds ratio (OR) and 95% CI (Confidence Interval). Analysis was adjusted for covariates, and all calculated p-values were two-sided, considered significant at p-values <.05 or if the 95% CIs of risk point estimates excluded one. Analysis was performed using the SAS software, version 9.4 (SAS Institute, Cary, NC, USA).
Ⅲ. Results
The general characteristics of MA type I study subjects are shown in Table 1. A total of 1,164 subjects were analyzed, of which 305 (26.2%) experienced unmet need and 188 (16.2%) experienced unmet need due to financial reasons. In the case of CHE, 284 (24.4%) subjects reported CHE at the 10% standard of a household’s capacity to pay and 58 (5.0%) subjects reported CHE at the 40% standard.
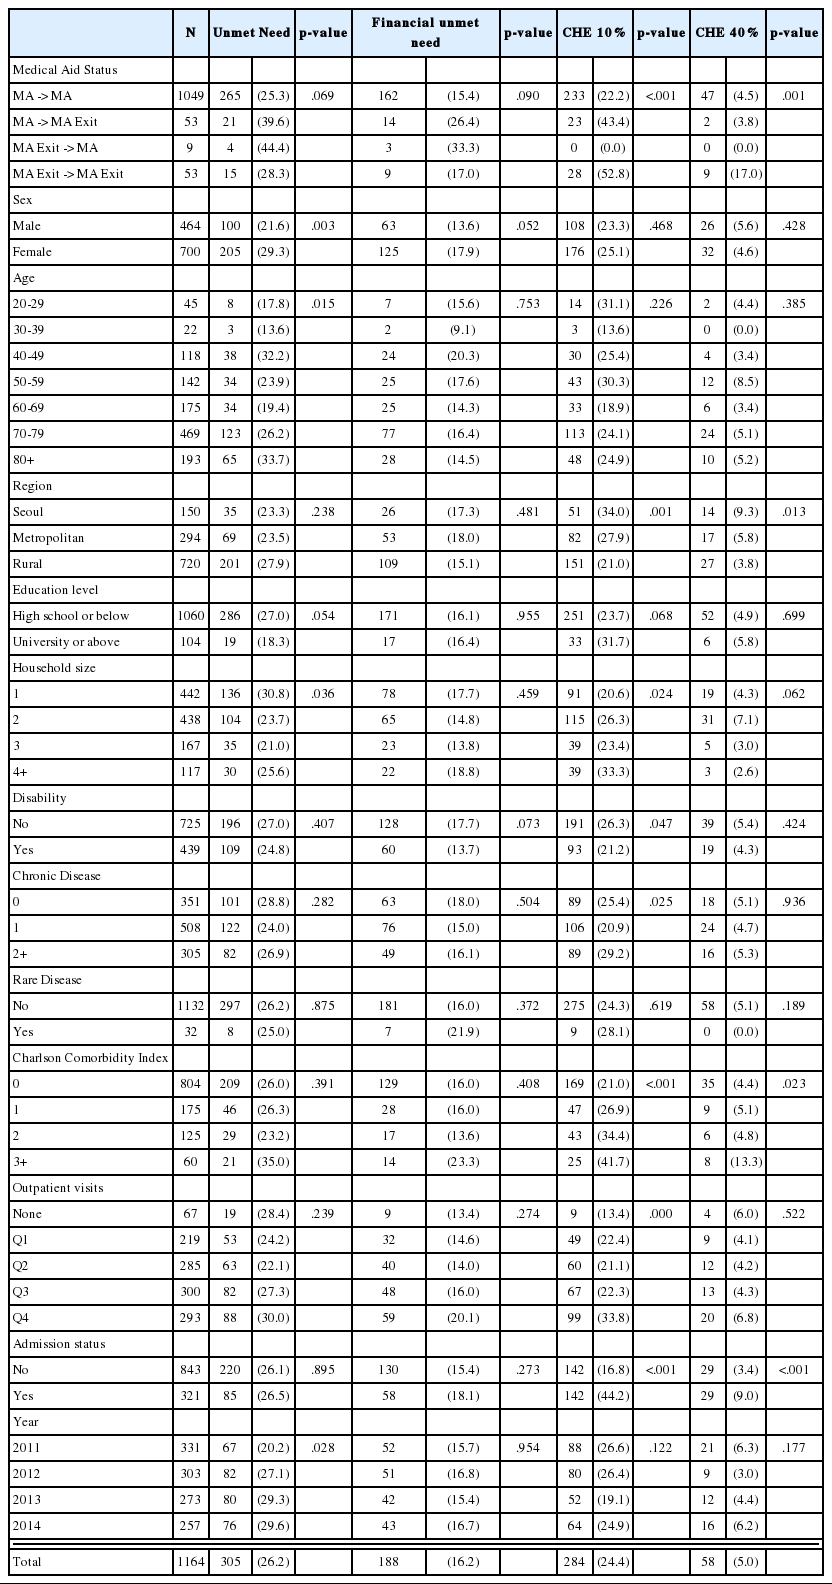
General characteristics of study observations in medical aid type 1 N (%)
Similarly, Table 2 presents the general characteristics of MA type II individuals. A total of 852 subjects were included in the analysis, of which 217 (25.5%) reported unmet need and 154 (18.1%) reported unmet need due to financial reasons. Additionally, 188 (22.1%) individuals had experiences of CHE at the 10% standard of a household’s capacity to pay and 35 (4.1%) individuals had experiences of CHE at the 40% standard.
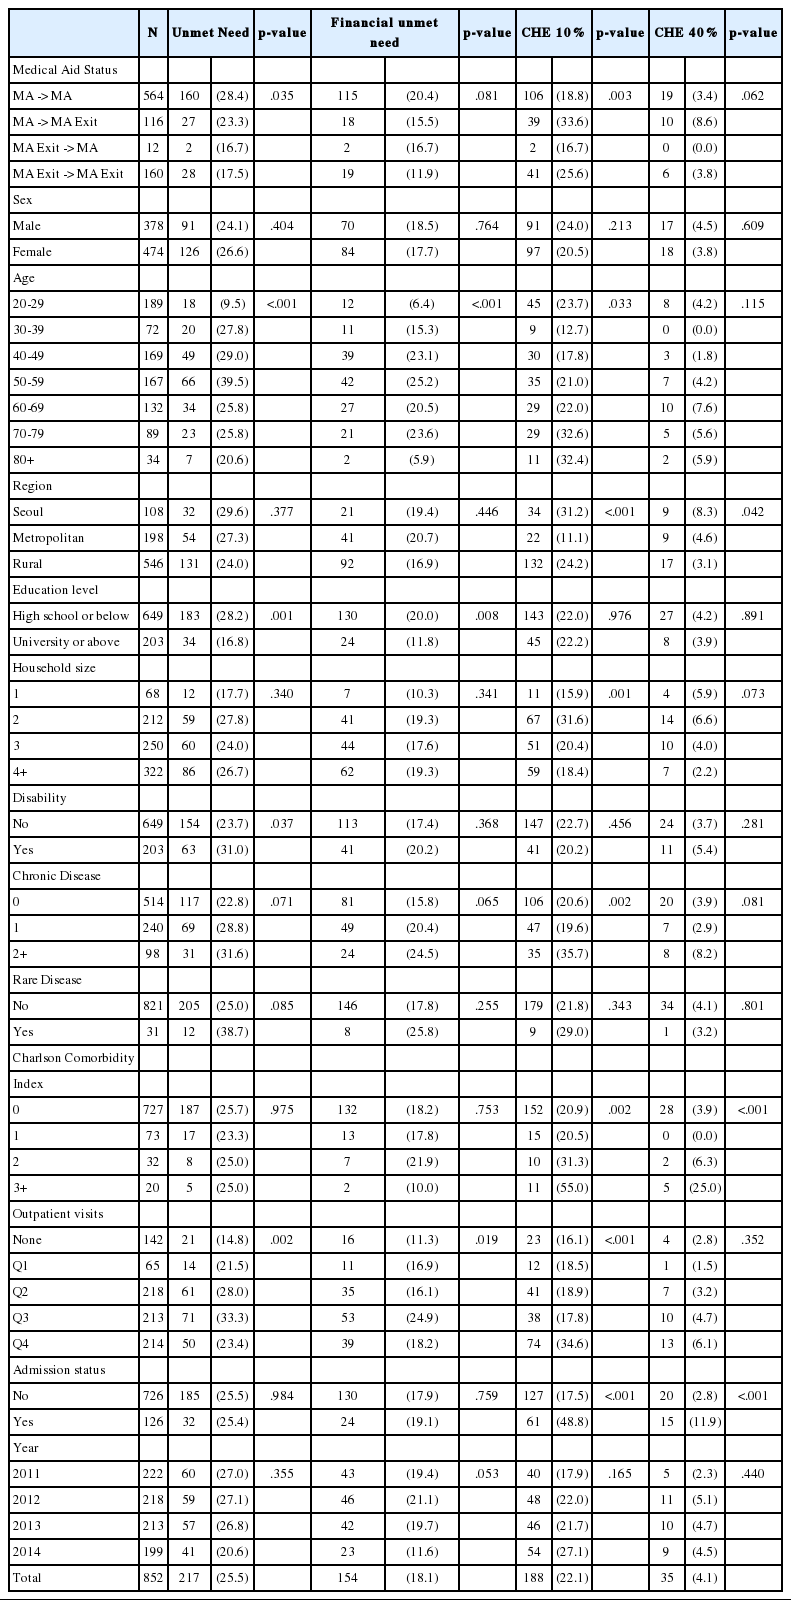
General characteristics of study observations in medical aid type 2 N (%)
The association between MA alteration status and unmet need and CHE in MA type I beneficiaries is presented in Table 3. In terms of unmet need, compared to the “MA to MA” reference group, subjects in the “MA to MA Exit” group showed increased likelihood of unmet need (OR: 2.43, 95% CI: 1.21-4.85) and unmet need due to financial reasons (OR: 2.26, 95% CI: 1.29-3.99). Regarding CHE, the “MA to MA Exit” (OR: 1.22, 95% CI: 1.07-1.40) and “MA Exit to MA Exit” (OR: 1.33, 95% CI: 1.13-1.57) groups showed increased likelihood of CHE set at the 10% standard of a household’s capacity to pay whereas the “MA Exit to MA” group (OR: 0.89, 95% CI: 0.82-0.97) showed decreased occurrences compared to the “MA to MA” group. Moreover, the “MA Exit to MA Exit” group (OR: 1.13, 95% CI: 1.02-1.26) showed increased occurrences of CHE set at the 40% standard of a household’s capacity to pay.
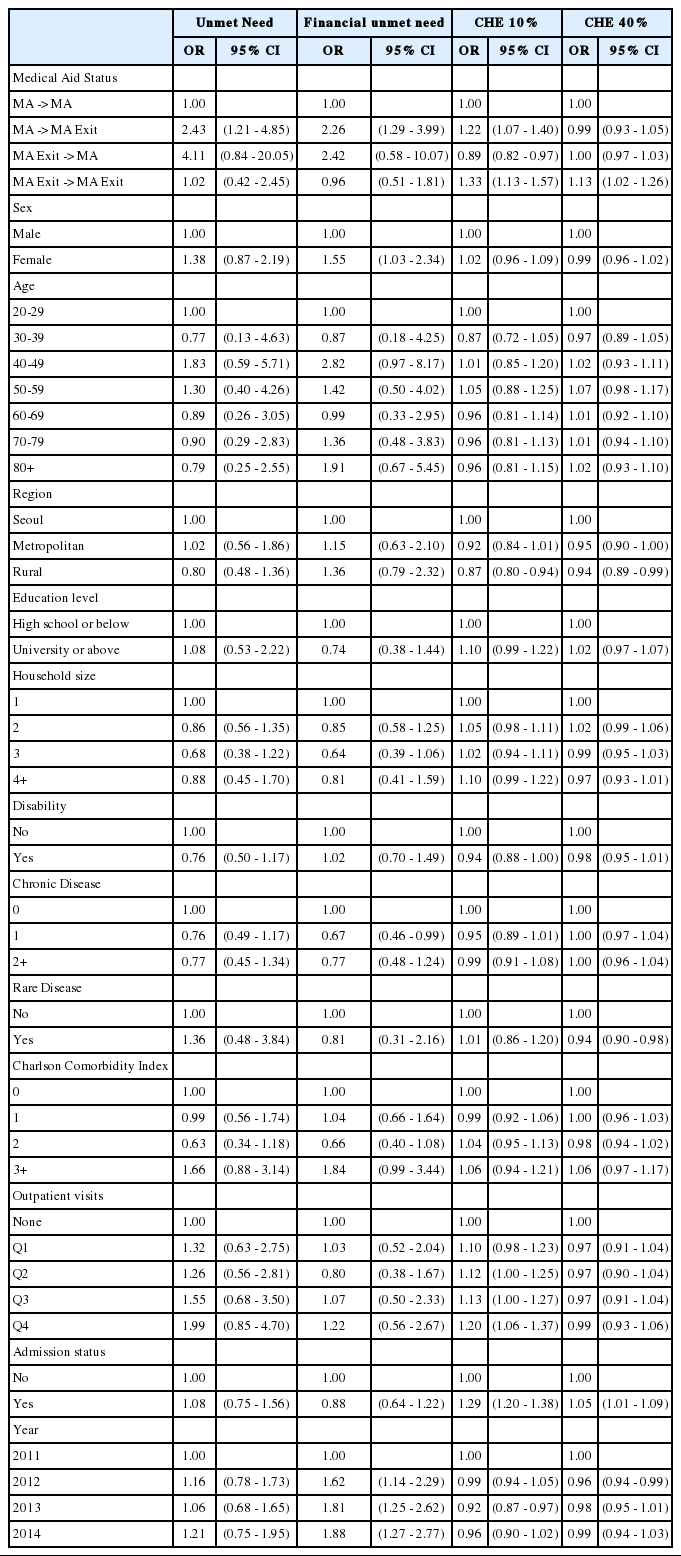
Results of the GEE analyzing the effect of medical aid status on unmet need and CHE in medical aid type 1
Lastly, the relationship between MA alteration status and unmet need and CHE in MA type II is shown in Table 4. No statistical significance was found between the four MA status groups regarding unmet need. However, compared to the “MA to MA” group, the “MA to MA Exit” group (OR: 1.14, 95% CI: 1.05-1.24) demonstrated increased likelihood of CHE set at the 10% standard of a household’s capacity to pay.

Results of the GEE analyzing the effect of medical aid status on unmet need in medical aid type 2
Ⅳ. Discussion
In MA type I individuals, higher likelihood of unmet need and unmet need due to financial constraints was present in individuals who exited MA beneficiary status compared to those with continuous MA coverage. In contrast, such tendencies were not found among MA type II beneficiaries. The findings are generally in accordance with previous studies in Korea which have demonstrated that the near poor groups show higher levels of unmet need due to financial constraints [18]. A study specifically focusing on the elderly also analyzed that the near poor elderly groups experience higher risks of unmet need due to both financial and non-financial constraints [19]. The results of this study add further insights by specifically showing that MA exits are associated with increased likelihood of unmet need and unmet need resulting from financial reasons. Furthermore, by distinguishing between MA type I and II beneficiaries, the findings reveal that such increased likelihood affects only the MA type I group consisting of individuals without work capability.
The findings on unmet need are comprehensible considering that MA exits can increase the level of financial burden experienced by formal recipients using health care services as individuals are no longer provided with the benefit of low-cost sharing. Furthermore, the increased odds of unmet need found only in type I individuals can be interpreted in the following way. Successful welfare exits of work-capable individuals, referring to exits following enhanced self-sufficiency, are promoted by the government which aims to prevent social exclusion and alleviate welfare dependency so that individuals take are able to carry responsibility and participate in the labor market [6,20]. Accordingly, individuals exiting MA as a result of increased income, who constitute around 50% of all exits, are reported to have average earnings at around 176% of the minimum costs of living [21-22]. However, not all MA exits are a result of improved individual economic sustainability, but they are also a consequence of administrative changes. This includes exits resulting from policy modifications and exposure of previously unreported wealth, income, or direct family support members. Individuals experiencing such coerced exits may experience financial difficulties afterward. As type I beneficiaries are evaluated to be devoid of work capability, exits from this group may largely be a result of administrative changes. Under such circumstances, type I exit group may be most vulnerable to financial and non-financial unmet health care needs, inferring that a particular emphasis should be put on alleviating occurrences of unmet need after welfare exits in this particular identified group.
Regarding CHE, type I and II individuals in the “MA to MA Exit” group showed higher likelihood of CHE set at the 10% standard of a household’s capacity to pay than those with continuous MA coverage. This suggests that MA exits may be interrelated with mild levels of CHE in which households experience modest levels of financial burden in utilizing health care services. The propensities found are plausible because MA exits do not always infer non-poverty, and studies have reported that low-income individuals without MA coverage often experience higher levels of health care costs and barriers to health care services [23]. Catastrophe has also been identified to positively correlate with out-of-pocket spending on health care [24]. Additionally, type I “MA Exit to MA Exit” group showed higher odds of CHE set at both the 10% and 40% standards of a household’s capacity to pay. Such trends were only found in MA type I individuals, inferring that individuals exiting MA without sufficient work capability may be particularly vulnerable to financial difficulties in receiving health care. Since the Korean health care system may function to induce relatively high individual cost sharing levels, the inclinations directed toward CHE in MA exit individuals are noteworthy.
This study has some limitations. First, as the KHP collect information based on surveyor visits, individuals with comparatively severe diseases are often unavailable or opt to not participate. Second, the KHP gather information on health care utilization through self-reports in which surveyors collect data retrospectively based on receipts. These two factors may distort information on health care utilization. Third, disease classification in the KHP 2010 to 2011 data was conducted by surveyors, which may have resulted in bias. However, starting from 2012, classification was conducted twice by surveyors and experts to enhance accuracy. Lastly, time dependent confounders were not taken into consideration. Future studies accounting for time varying covariates may be beneficial in further enhancing the understanding of this subject.
Ⅴ. Conclusion
The findings demonstrate that MA exits are related to higher likelihood of all-cause and financial unmet need in the MA type I group. Both type I and II MA beneficiaries exiting MA status were more likely to experience mild levels of CHE. Together, the results suggest that type I individuals exiting MA status may be at a particular risk of unmet need and CHE. Considering that MA beneficiaries are known to utilize noticeably higher levels of health care services and that most of the beneficiaries are socially vulnerable individuals often of poorer health status, individuals with experiences of receiving benefits should be closely monitored so that appropriate use of health care services is promoted while occurrences of unmet need and CHE are reduced.
Notes
Funding
None
Conflict of Interest
None