


Ⅰ. Introduction
Cancer is the most common chronic disease, with a rapidly increasing incidence (from 214.2 per 100,000 people in 1999 to 415.7 per 100,000 people in 2010) [1]. With this remarkable increase, the proportion of mortality due to cancer has also doubled. In addition, the economic burden due to cancer has been increasing continuously, and it was estimated at about 2.11 billion dollars in 2014; which is about 5% of the total healthcare expenditure in 2014 [2].
Since 1996, the Korean government has been developing a 10-year plan for cancer control, to reduce the problems related to caner, and to establish the infrastructure required for managing cancer patients [3].The government established the National Cancer Center in 2000, and introduced the Cancer Control Act in 2003, to relieve the burden cause by cancer and to contribute to the promotion of national health [4]. These changes in policies for cancer patients improved the infrastructure related to cancer has remarkably. However, there still remain some concerns about cost burden or mortality, as Korea faces an aging society. Therefore, the Korean government decided to expand the insurance coverage for severe patients including cancer, and a reducing copayment of cancer patients was introduced since Jan 2004. This program was expanded in phases (from 30% to 20% copayment in outpatient care in Jan 2004, from 20% to 10% total copayment in Sep 2005, and from 10% to 5% total copayment in Dec 2009) [5]. Although there are controversies about the levels of optimal coverage, the positive impact have been analyzed in previous studies [16].
The policies for cancer in Korea have also changed from another point of view. Up until the mid-2000s, the policies for cancer patients mainly focused on improving the level of structure and environment in cancer care access and cost. Thus, the focus of policies for cancer has turned towards quality aspects since the mid-2000s [6]. In 2007, the Korean government introduced public reporting in cancer care, as part of the Healthcare Quality Assessment that was implemented in 2000, to evaluate whether optimal benefits coverage was provided to patients. This program initially mandates public reporting of hospital-level surgical volume for 7 types of surgery including gastrectomy in patients with gastric cancer (Table 1). If hospital-level surgical volume met the criterion, the hospital was considered a better grade hospital. It had substantial meaning in cancer care because this was the first program that evaluated the quality of care and informed cancer patients about the results, which in turn helped improve their informed choice of hospitals for seeking surgical treatment. Public reporting about hospital performance might affect patient’s criteria for choosing a hospital, because patients could get more information and make an informed choice by using a public report rather than basing it on reputation or experience [7-8]. The purpose of this study was to investigate the changes in patient behaviors after public reporting of hospital-level surgical volume among patients who received gastrectomy. This study identified the association between patients’ choice of hospital, as an indicator of patient behavior, and introduction of public reporting.
Ⅱ. Methods
1. Study population
The data used in this study was derived from the National Health Insurance Service National Sample Cohort 2002–2013. We included the patients who were diagnosed with gastric cancer based on the International Classification of Diseases (ICD)-10 code (ICD-10: C16, 8,420 patients), and only included the patients who underwent gastrectomy due to gastric cancer (3,314 patients with gastrectomy). Subsequently, to assume the new diagnosis reflecting the medical claim data, we excluded the patients with gastric cancer before 2004 (2,358 gastric cancer patients with gastrectomy during 2004–2013). Additionally, the public reporting reflected the results of the evaluation for surgical volume based on hospital performance. Therefore, we excluded the patients at hospitals which had no details about surgical treatment provided in the previous year. Further, to analyze patient outcomes, we excluded the patients with a follow-up period of less than 1 year. Finally, the data comprised 2,214 patients who were diagnosed with gastric cancer and underwent gastrectomy in 105 hospitals during 2004–2012. This study was approved by an Institutional Review Board, Yonsei University Graduate School of Public Health (2-1040939-AB-N-01-2016-411-01).
2. Variables
We considered the patients’ choice as outcome variables. Patients’ choice of a hospital was defined based on whether patients visited a hospital with high surgical volume to receive the surgical treatment due to gastric cancer. The hospitals were classified as “high” based on surgical volume in the first quartile of the previous year, with reference to the current criterion of public reporting (Table 2).
In the analysis of patient choice, the interesting variables were the introduction of public reporting about surgical volumes for gastrectomy, trends after introduction of public reporting, and baseline trends. The introduction of public reporting was defined as “before” and “after” using Dec 2007 as a reference point. Trends after the introduction of public reporting were used to analyze the linear changes in the trend after introducing the public reporting. The baseline trends were stratified by month from 2004 to 2012.
Other independent variables were also used in this study. Age was categorized into five groups, as follows: “less than 39 years,” “40–49 years,” “50–59 years,” “60–69 years,” and “more than 70 years”. Income level was categorized into four groups, “less than 30th percentile,” “31st–60th percentile,” “61st–80th percentile,” and “81st–100th percentile.” The types of insurance coverage were categorized as medical aid, National Health Insurance (NHI) employed, or NHI self-employed based on the NHI criteria. Due to limitation of the healthcare claim data, we could not consider the cancer staging such as Tumor, Nodes, and Metastasis (TNM) or Surveillace, Epidemiology, and End Results (SEER) summary staging. Alternatively, to minimize the limitations of the absence of data on cancer staging, we considered the types of surgery and types of treatment during the treatment period of each patient as independent variables in this study. The Charlson Comorbidity Index (CCI) was calculated by weighting and scoring other comorbid conditions with additional points added to consider comorbidities that could affect health outcomes, and it was categorized into “0–1,” “2,” and “more than 3.”
3. Statistical analysis
In the analysis on patients’ choice, we first examined the frequencies and percentages of each categorical variable by whether patients visited the hospital with surgical volume above that of the first quartile of the previous year, and performed the chi-square test to examine the distribution of visits to a hospital with high volume according to each categorical variable. We then showed the monthly distribution of patients who visited a hospital with high volume, and compared trends by the introduction of public reporting. Next, we performed the interrupted time series analysis using the Generalized Estimated Equation (GEE) model with Poisson distribution and log link function adjusting patient-level variables to investigate the association between patients’ choice of hospitals and the public reporting [9]. In addition, during the study period, other health policies about reducing the copayment of cancer patients were also introduced (1st phase in Jan 2004, 2nd phase in Sep 2005, and 3rd phase in Dec 2009). Based on the results of previous studies [4], the 2nd and 3rd phases of policies were found to affect patient behaviors. Therefore, we performed a sensitivity analysis for the interrupted time series analysis adjusting for additional health policies about reducing copayment in Sep 2005 and Dec 2009. As the public reporting was introduced into several disease categories including gastric cancer after 2007, we additionally analyzed the association between patients’ choice of hospitals and the introduction of public reporting in colon cancer patients to support the results of gastric cancer. Finally, we performed a sub-group analysis, to examine the differences in association with public reporting according to income level, types of insurance coverage, region, types of treatment, and types of surgery.
Ⅲ. Results
Table 3 shows the frequencies and percentages of patients by visiting a hospital with high surgical volume, and the results of the chi-square test for identifying the distribution of the study population. There were 2,214 patients, 79.3% of which visited a hospital with high surgical volume as compared to that in the first quartile of the previous year (n=1,755 patients). Overall, patients who visited a hospital with a high volume of gastrectomy reduced after the introduction of public reporting, but this difference was not statistically significant (before: 80.7%, after: 78.4%, p=0.191).
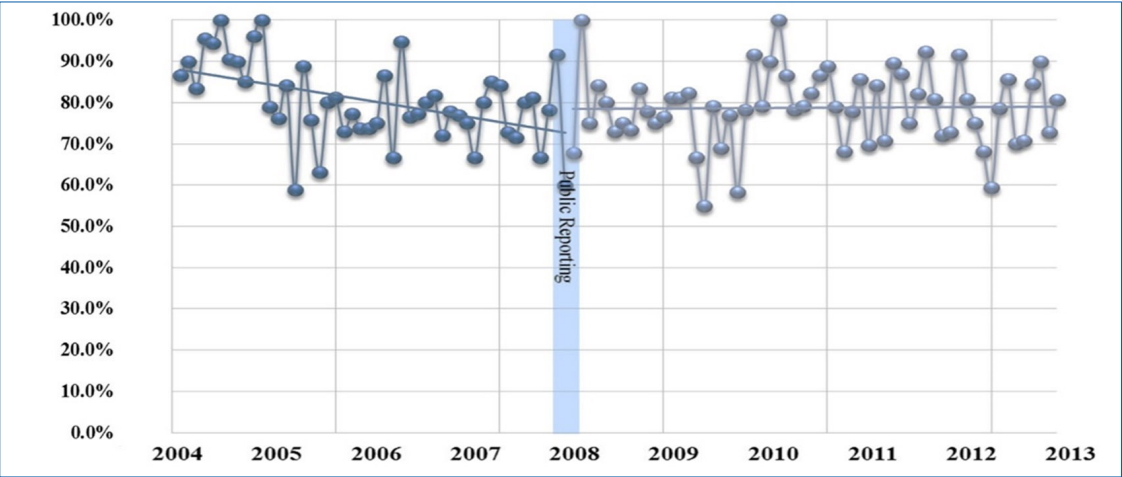
The proportion of patients who visited a hospital with high volume as compared to that observed in the first quartile of the previous year among patients who were diagnosed with gastric cancer and received the gastrectomy increased gradually after the introduction of public reporting (Figure 1).
The introduction of public reporting had no statistically significant association with visiting a high volume hospital, and the baseline trends had a significant inverse association. On the other hand, the time trend after introduction of public reporting was positively associated with risk in visiting a high volume hospital (per 1 month, RR: 1.004, p=0.033) (Table 4).
By the results of sensitivity analysis adjusting for additional health policies about reducing copayment, there was a positive association with visiting a high volume hospital after the introduction of the 2nd and 3rd copayment policy or after the time trends of such policies. However, the introduction of public reporting about surgical volume was not significantly associated with visiting a high volume hospital (Table 5).
We also performed additional analysis for colon cancer for supporting those of gastric cancer. The results suggest the public reporting in colon cancer could influence in patient`s choice of hospital. However, its association with the patient`s choice was also disappeared adjusting other political variables similar with those about gastric cancer (Table 6).
Sub-group analyses revealed similar findings. By income level, a significant positive association was revealed between visiting a hospital with high volume and the time trends after public reporting in higher income, NHI benefits, rural areas, or relatively mild clinical status. However, considering copayment policies, there was no association between public reporting and visiting a hospital with high surgical volume (Table 7).
Ⅳ. Discussion
Public reporting aimed to provide alternatives available for patients and to improve the overall quality of care in hospitals though informing surgical volume as proxy indicators. In the US, the Agency for Healthcare Research and Quality (AHRQ) and Leapfrog Group initiated the public reporting on hospital minimum volume for some services, to assist patient’s choice of hospitals based on the volume-outcome relationship, before it was introduced in Korean in Dec 2007 [10-11]. Considering the positive role of public reporting in the US, the introduction of public reporting about surgical volume for some surgeries in Korea might have had a positive impact for both patients and hospitals. In particular, this introduction was the first attempt to evaluate the quality of care in cancer patients even though surgical volume was just a proxy indicator of quality performance.
Based on the results of this study, patients’ choice of a hospital with a high surgical volume had slightly increased after the introduction of public reporting. Based on the conceptual framework of Bloom increased information would lead to more informed patient choices and more intense provider competition, which will continue to improve the quality of care and prevent excessive medical expenditures [12]. Finally, it would lead to better health outcomes in patients. So far, previous studies reported patients visit a hospital based on subjective criteria such as distance, hospital staff, hospital size, brand, image, and reputation, rather than on objective criteria, before the introduction of public reporting. Bloom et al. reported that this changed after the introduction of public reporting because patients made hospital choice decisions based on public information such as quality indicators. Our findings were seemed to be line with those results.
However, until now, the cancer policies in Korea focused on the aspects of accessibility and reducing cost burden, and, according to the findings of previous studies [4], such policies had substantial impacts on cancer patients. Previous studies reported that the reduction in the copayment in cancer care and the extension of benefit coverage in cancer could reduce the inequality between income levels, which could reduce the catastrophic expenditures involved in cancer care [13]. In addition, the policy on copayment in cancer patients could strengthen the treatment options for cancer patients [14- 15]. Further, cancer patients could receive optimal treatment in the early stages by the introduction of such policies [16]. On the other hand, the public reporting about surgical volume was relatively out of the spotlight because the expected effect was small. Thus, we also performed a sensitivity analysis to examine the impact of public reporting considering the impact of the policy on reducing copayment in cancer care. The results of this analysis showed that public reporting was not associated with patient choice for hospitals with high volume, unlike that reported in the conceptual framework of Bloom [12] Also, we concerned that there were some limitations to generalize the impact of public reporting considering only the results from gastric cancer. We additionally analyzed the impact of public reporting in colon cancer patients. The additional analysis, showed similar results that public reporting could affect to patient`s choice, but such impacts relatively weaken than reducing copayments.
Similar findings were analyzed in the sub-group analysis. There were some statistically significant differences in the impact of public reporting according to sub-group variables. However, these associations also disappeared after adjusting for the impact of policies on reducing copayment in cancer care, which was similar to the results of the sensitivity analysis. These results might be caused by the relatively weaker impact of public reporting on patients than that of other policies which supported their economic aspects. Thus, in cancer care, the policy related to economic support is more likely to affect patients rather than other policies, including public reporting of hospital-level surgical volume, and the positive association of public reporting on patient choice and the differences according to sub-groups might be actually be caused by the impact of the economic support provided through other policies. It means that the public reporting, which aims to support the availability of health information, was not effective in improving cancer care than other economic supports. Thus, there is a need to review the strategies for activating the utility of public reporting for patients. In particular, by the previous studies about the impact of public reporting, most of them (about 70%) commonly introduced public reporting as website like Korea although some adopted paper reports method. In success of public reporting, the improvement of user convenience, not route of public reporting was reported as key factor. Regarding that, policy makers have to review alternatives for increasing the patient convenience in the public reporting [10-11,17].
Our study has some strengths. First, we used the NHI national sampling cohort data from 2004–2012. As already mentioned in methods section, this data was originally produced using systematic sampling methods based on the total population in 2002, and it consisted of follow up data on 1,025,340 individuals during 2002–2013. These data had strengths with reference to the generalizability for the results of this study. Second, it is the first attempt to evaluate the impact of public reporting about surgical volume among cancer patients, in particular, gastric cancer patients. Thus, the results of this study could be used in making evidence-based healthcare policy or programs. Next, in the statistical analysis, we performed the interrupted time series analysis. This method was useful in measuring the impact of the policy or intervention even though this method could not reflect the linear trend in each segment. It could control for prior trends in the outcome variable and analyze the dynamics of change by public reporting without a control group. Thus, the interrupted time series analysis could measure the baseline trends, step change, and trend change caused by the introduction of public reporting [18-21].
However, this study has also some limitations. First, by the nature of the present dataset, we could not consider variables which could reflect such variations on informed patient choice, except for types of insurance coverage and income levels. In particular, the patients awareness on public reporting and how they use it could be key factors in the evaluation of public reporting. However, we could not capture related factors [11,22]. Second, patients with healthy behavior or more attention to health information would generally make more informed decisions regarding the selection of hospitals [23]. These factors were also not included in this study. Third, cancer staging is major factor that reflects the severity of cancer patients, it affected the decision for treatment and patient outcomes among cancer patients. However, the data used in this study did not include the information about cancer staging. In this study, to solve the limitations on cancer staging, we considered types of surgery and types of treatment as independent variables [24]. Fourth, in the methods, we defined the outcome variable based on the first quartile value of surgical volume in the previous year, because the criteria for better hospitals in the public reporting about surgical volume was defined based the quartile of surgical volume. However, by the nature of sampling data, the first quartile of surgical volume could be underestimated. Thus, the events of visiting a hospital with higher surgical volume than that observed in the first quartile in the previous year could be overestimated, and the study results on patient choice could differ from the actual situation. Finally, Healthcare Quality Assessment (introduced after 2014) would be important factors in patient choice, but the data used in this study could not capture related periods.
Ⅴ. Conclusion
This study concluded that public reporting about surgical volume was not associated with patients’ choice of hospital. Patients were more affected by policies on economic support rather than public reporting, and the changes in treatment options may have been affected by an increasing preference for large size hospitals. Thus, public reporting did not well operate effectively for improving the options available for patients. There is a need to review the strategies for activating the public reporting.